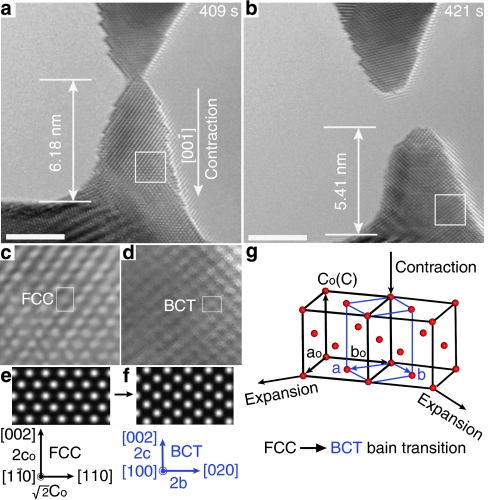
Figure 3. Surface stress-induced phase transformation.
(a) The moment before nanocrystal fractures. (b) The contraction (relaxation) of the bottom part of Au crystal after the crystal fractures. The scale bar in each figure represents 3 nm. (c, d) Enlarged HRTEM images of the white-boxed area in a and b, respectively, accompanied with the corresponding crystallographic orientation. (e) Simulated HRTEM image of FCC Au along [110] zone axis with lattice parameter of a=4.078 Å. (f) Simulated image of BCT Au along [100] zone axis with lattice parameter of a=b=3.34 Å and c=2.86 Å. The simulations were conducted by applying the parameters including the acceleration voltage of 300 kV, spherical aberration coefficient of the 1.2 mm, the specimen thickness of 3 nm and the focus value of −43 nm. (g) Martensitic transition (FCC–BCT) due to lattice distortion along [001] direction in FCC crystal on the basis of the Bain path. The unit cells of FCC and BCT crystals are outlined with black and blue lines, respectively.

