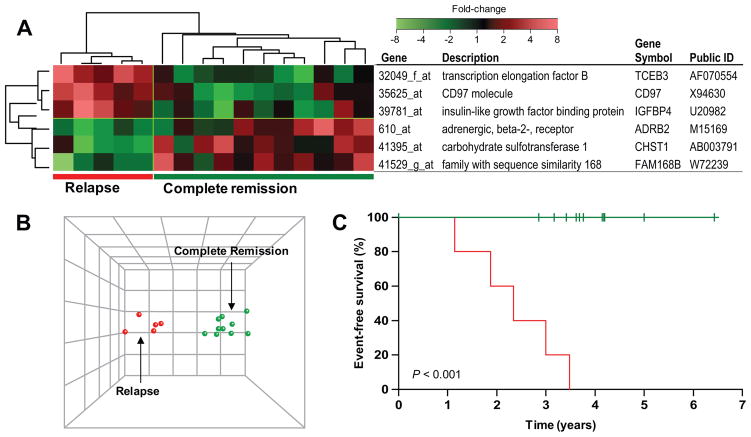
Figure 1. Gene expression changes that discriminate treatment outcome.
(A) Expression changes of the six most discriminating genes by linear discriminant analysis (LDA) in patients who remained in complete remission (n =11) and in patients who relapsed (n = 5). (B) Principal component analysis (PCA) plot of 16 patients who received LDMTX/MP, using the six most significant genes predictive of relapse (P = 0.028). (C) Event-free survival curves estimated by Kaplan-Meier analysis.

