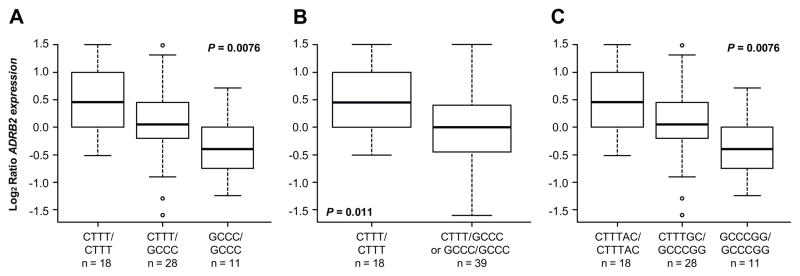
Figure 2. Treatment induced changes in ADRB2 gene expression, by ADRB2 promoter haplotypes/diplotypes.
Treatment induced changes in ADRB2 gene expression in 57 patients with ALL, by ADRB2 promoter haplotypes/diplotypes. Box and whisker plots show the medians (horizontal line), interquartile ranges (box), and ranges (whiskers) of changes in ADRB2 gene expression, excluding outliers which are shown as circles. (A) The haplotypes shown are, CTTT/CTTT or CTTT homozygotes (n = 18), CTTT/GCCC or CTTT/GCCC heterozygotes (n = 28), GCCC/GCCC or GCCC homozygotes (n = 11); P = 0.0076, Kruskal-Wallis test). (B) The diplotypes shown are, CTTT/CTTT or CTTT/GCCC (n = 46), GCCC/GCCC or GCCC homozygotes (n = 11); P = 0.0104, t-test). (C) The diplotypes shown are, CTTT/CTTT or CTTT/GCCC (n = 46), GCCC/GCCC or GCCC homozygotes (n = 11); P = 0.010, t-test).

