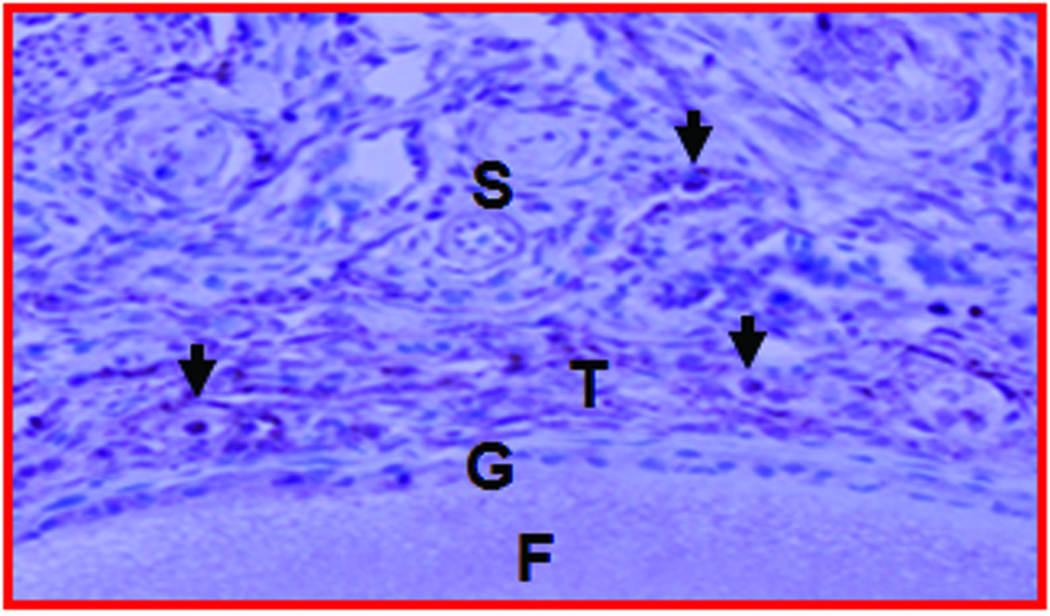
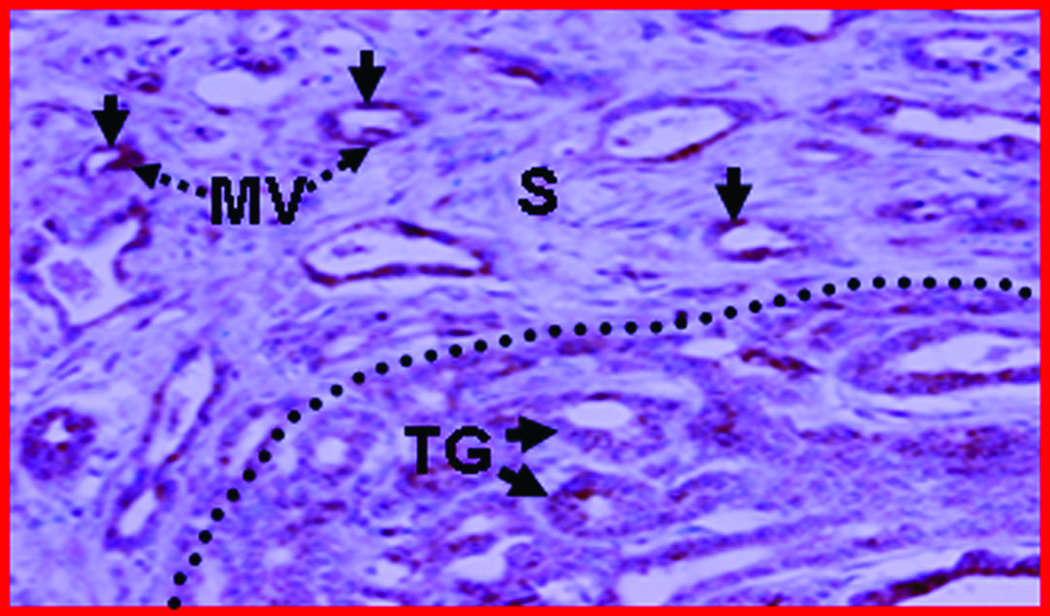
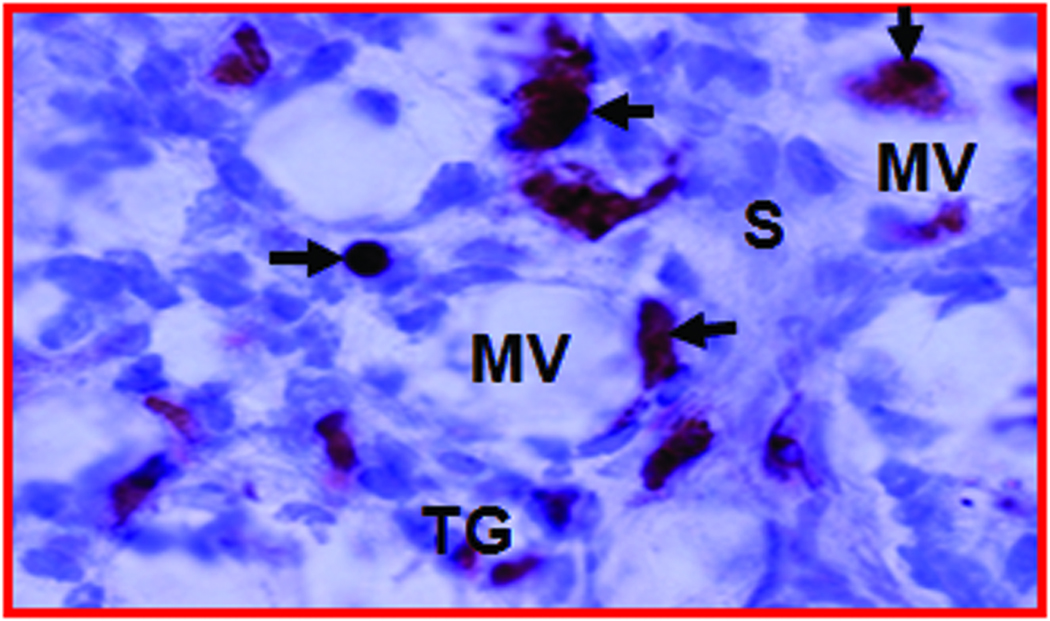
Figure 3.
Expression of neoangiogenic markers in hen ovaries predicted to be normal and with ovarian TAN by ultrasonography. A, Section showing normal vasculature with few VEGF stained vessels in the follicular theca and stroma of a hen monitored prospectively by ultrasonography up to 45 weeks (from the hen shown in Figure 2A; original magnification 40X). B, Ovarian section of hen suspected to have ovarian TAN by ultrasonography (from the hen shown in Figure 2C; original magnification 40X). In contrast to A, many microvessels and the tumor epithelium expressed VEGF with high intensity. More VEGF expressing microvessels are seen in the tumor vicinity and in the stroma preceding tumors (separated by an imaginary dotted line). The numbers of VEGF-expressing microvessels in hens suspected to have ovarian TAN are negatively correlated to their ovarian Doppler indices (RI and PI; see “Materials and Methods” for detail analysis. Furthermore, the pattern of localization of VEGF-positive vessels in TAN-diagnosed hens suggests that ovarian TAN precedes tumor progression and is associated with decline in Doppler indices. C, Frozen ovarian section of a hen with ovarian tumor (shown in Figure 2C) immunostained for αvβ3-integrins (original magnification X100). αvβ3-integrins are expressed in the microvessels. F indicates follicle; G, granulosa layer; MV, microvessels; S, stroma; T, theca layer of stromal follicle (F); TG, tumor glands. Arrows indicate the examples of immunopositive vessels (A–C) and arrow heads indicate examples of immunopositive tumor glands (B and C).


