
Fig. 2.
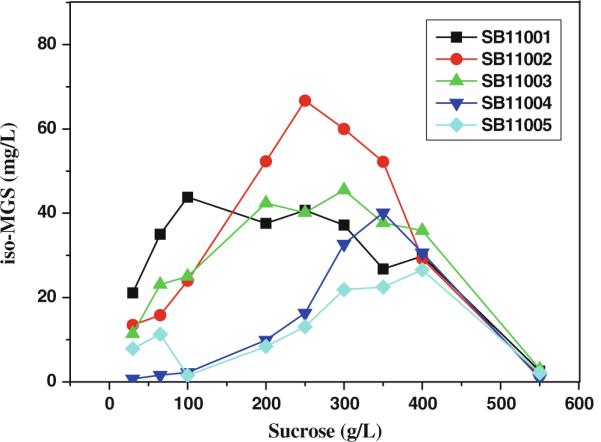
iso-MGS production titers as a function of sucrose concentration in five host strains. All the shake flask experiments were carried out in triplicate. The iso-MGS titer in the figure was the average value of three parallel tests, and all the standard deviations were less than 7%