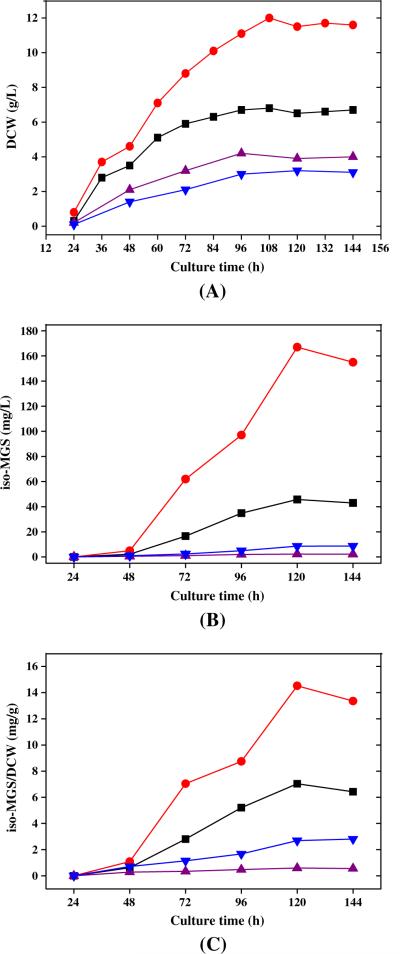
Fig. 6.
Time-course comparisons of cell growth (a), iso-MGS concentration (b), and specific iso-MGS productivity (c) with SB11001 strain among in four different media. All the shake flask experiments were carried out in triplicate. The iso-MGS titer in the figure was the average value of three parallel tests, and all the standard deviations were less than 8%. Filled squares—R2YE medium, filled triangles—B2 medium, filled down-pointing triangles—YEME medium, filled circles—optimized HBR medium

