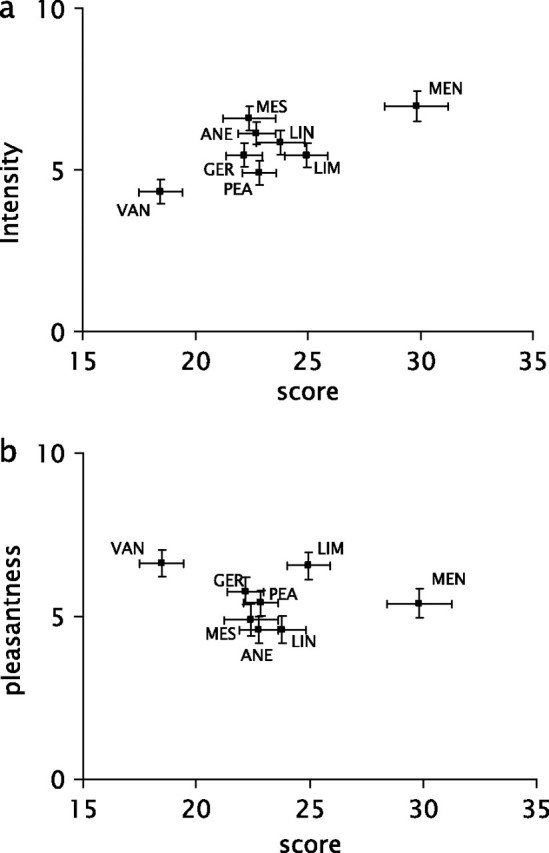
Figure 3.

(a) Correlation between mean scores (maximum: 40, chance: 20) and average intensity (0–10) for 40 subjects. Error bars indicate standard error of the mean. (b) Correlation between mean scores (maximum: 40, chance: 20) and average pleasantness (0–10) for 40 subjects. Error bars indicate standard error of the mean.
