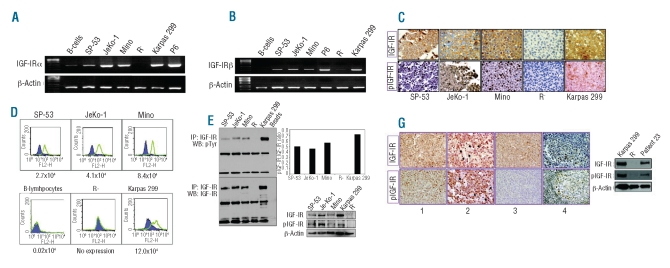
Figure 1.
Expression of IGF-IR and pIGF-IR in MCL cell lines and human samples. RT-PCR showed the expression of IGF-IRα (A) and IGF-IRβ mRNA (B) in three MCL cell lines. The cell lines Karpas 299 and P6 were used as positive controls. In contrast, very low levels of IGF-IRα and IGF-IRβ mRNA were detected in B-lymphocytes and very low levels of IGF-IRβ were detected in the R− cell line. The expression of IGF-IRβ and pIGF-IR proteins was documented in the MCL cell lines by using immunohistochemical staining (original magnification: ×400) (C). The cell lines R− and Karpas 299 were used as negative and positive controls, respectively. Flow cytometry measuring relative IGF-IR antigen density per cell demonstrated an up to 420-fold increase in the expression of IGF-IRα molecules per cell in MCL cell lines compared with in normal human B-lymphocytes. R− and Karpas 299 cell lines were used as negative and positive controls, respectively (D). Expression of IGF-IRα is represented by the green peaks and the IgG1 isotypic control by the purple areas. Estimated numbers of IGF-IR molecules per cell are shown. Immunoprecipitation followed by western blotting demonstrated the expression of pIGF-IR and IGF-IR in SP-53, JeKo-1, and Mino cell lines. The R− and Karpas 299 cell lines were used as negative and positive controls, respectively (E, left panel). Densitometric analysis shows that pIGF-IR represented 50%, 46%, 57%, and 72% of total IGF-IR in SP-53, JeKo-1, Mino, and Karpas 299 cell lines, respectively (E, right panel). Western blot studies show the expression of IGF-IR and pIGF-IR in MCL cell lines after culture in serum-deprived medium for 24 h. Rand Karpas 299 cell lines were used as negative and positive controls, respectively (F). Immunohistochemical staining demonstrated the expression of IGF-IR and pIGF-IR in 78% and 74%, respectively, of MCL primary specimens. Panels 1 and 2 illustrate two cases that were positive for IGF-IR and pIGF-IR, and panel 3 depicts a case that was positive for IGF-IR and negative for pIGF-IR (original magnification: ×400). The black arrowheads in panel 2 highlight interstitial histiocytes that were negative for both IGF-IR and pIGF-IR proteins. Panel 4 shows the expression of IGF-IR and pIGF-IR in a reactive lymph node. IGF-IR and pIGF-IR were weakly expressed in some of the large lymphocytes within the germinal center, and strongly expressed in scattered plasma cells and lymphoplasmacytoid lymphocytes. Because of lack of tumor tissue material from patient 23, western blotting was performed on MCL cells from a peripheral blood sample, and showed the expression of IGF-IR and pIGF-IR (G).

