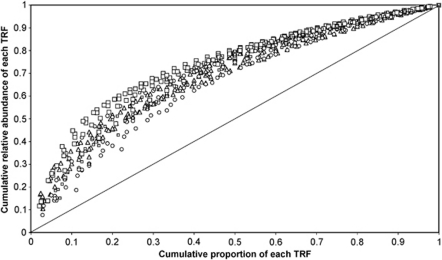
Figure 2.
Pareto–Lorenz distribution curves for bacterial T-RF abundance patterns from the three glaciers. Samples from ML cryoconites (squares) show the most uneven distribution of taxa, with AB (circles) showing the most even distribution, and samples from VB (triangles) being intermediate. The diagonal gray line indicates a theoretical even distribution. Gini coefficients derived from Pareto–Lorenz curves for AB samples were significantly different (Tukey's honest significant difference) from ML and VB samples.

