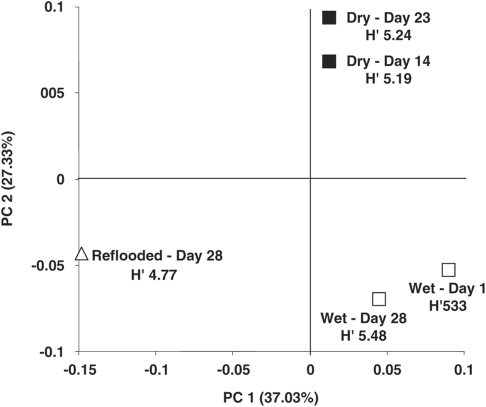
Figure 5.
Change in community structure in desiccated and subsequently reflooded sediments relative to the wet control sediments (as labelled) as revealed by UniFrac principal component analysis of 16S rRNA gene 454 pyrosequencing libraries. Comparison is based on the UniFrac metric, which measures the difference between the libraries in terms of the branch length that is unique to one library or the other after a phylogeny construction of ∼4250 sequences. Shannon diversity scores (H′) calculated from RDP alignment and clustering at the 3% level.

