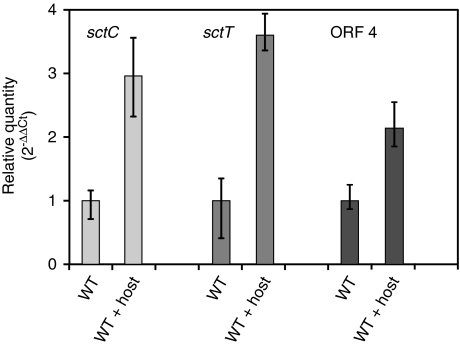
Figure 5.
T3SS gene expression assay. Expression of T3S genes sctC (left) and sctT (middle) and ORF 4 (right) in B. rhizoxinica monitored by quantitative real-time PCR both in pure culture and in cocultivation with cured host (R. microsporus). The 16S gene was used as an internal standard for calculation of expression levels and normalization. Expression of both genes is significantly increased in the wild type (WT) during cocultivation.

