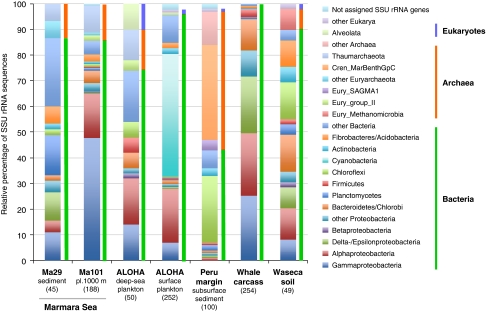
Figure 2.
Relative proportions of different archaeal, bacterial and eukaryotic taxa identified in different metagenomic data sets based on their content of SSU rDNA sequences. The taxonomic assignment was carried out using MEGAN. The total number of SSU rDNA matches in each metagenome is indicated in parentheses.

