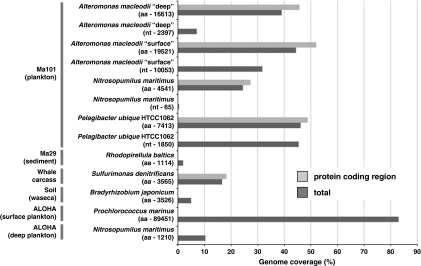
Figure 7.
Percentage of coverage of the most abundantly recruited genomes in Marmara deep-sea plankton (Ma101) and sediment (Ma29) as compared with those most represented in other selected metagenomes. The numbers in parentheses indicate the numbers of matching reads; aa, based on amino acids (promer); nt based on nucleotides (nucmer).

