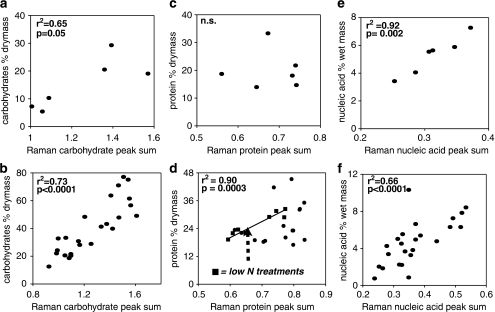
Figure 1.
Compares macromolecular composition measured using analytical chemistry with that generated from Raman microspectroscopy (sum of mean peak height for all peaks in each macromolecular category). V. spinosum are presented in the top row (a, c and e) and P. carotovorum are presented in the bottom row (b, d and f).

