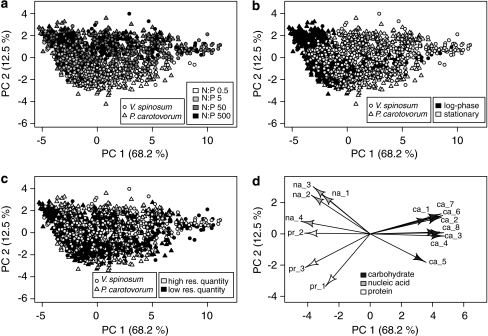
Figure 3.
Principal component analysis (PCA) was computed on 15 Raman peaks belonging to specific macromolecule classes. Scores on first and second principal component, commonly explaining 80.7% of data variation, color coded by (a) resource N:P, (b) growth phase and (c) resource quantity. (d) PCA loadings (correlations of macromolecules with the principal components) with absolute values >0.25 on either of two principal components indicate contributions of the various macromolecules to the ordination. Although carbohydrates, and protein 2 and 3 load primarily on PC 1, nucleic acids and the remaining proteins load about equivalently on both PC 1 and 2. Loadings are scaled by a factor of five.

