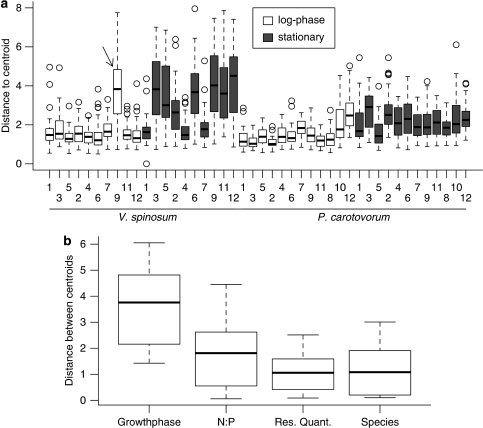
Figure 5.
Analyses of distances indicating differences in macromolecular composition. (a) For each unique treatment (Table 1) multivariate distances of individual cells to the treatment centroid in Euclidean space were computed based on the 16 Raman peaks. Histograms of distances to the centroid express the variation of macromolecular composition among individual cells of the various treatments. Data of one treatment (marked by an arrow) was excluded to allow computation of the two-way ANOVA testing effects of growth phase and species. (b) For each factor, distances between centroids were calculated while holding all other factors constant. All boxplots show median (black line), 1st and 3rd quartiles (box), and 5 and 95% quantiles (whiskers).

