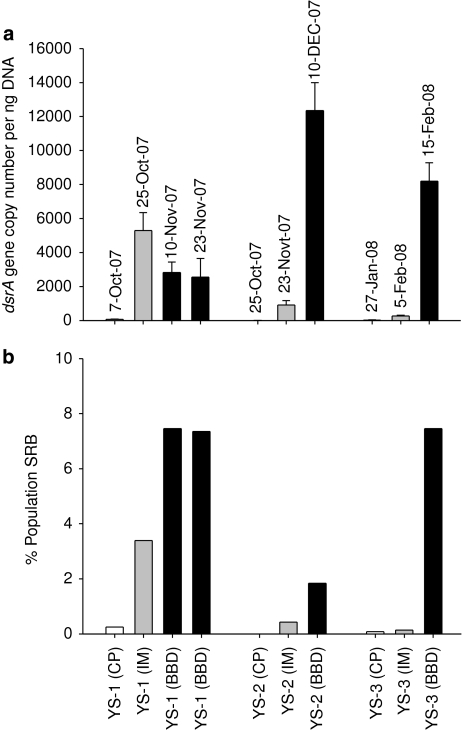
Figure 2.
(a) Quantitative real-time PCR (RT-PCR) targeting dsrA genes of SRB in diseased lesions of coral samples. Values represent dsrA gene copies per ng extracted DNA and are given as mean ± standard deviation of triplicate samples over a 10 × serial dilution range of template DNA (50 ng–0.05 ng). (b) Number of SRB in diseased lesions (calculated from A) relative to the total bacterial population determined by quantitative RT-PCR targeting 16S rRNA genes within lesion samples. Coral colonies YS-1, YS-2 and YS-3 were visually assessed as displaying CP, IM or BBD stages of the lesions and the sampling dates of the lesions are also provided.

