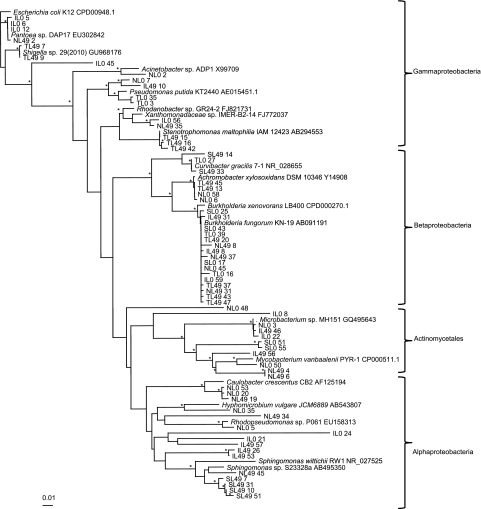
Figure 4.
Phylogenetic analysis of the 16S rRNA gene sequences from selected clones. Included are type strains obtained from GenBank. Sequence analysis was performed on common partial sequences (>500 bp) using Jukes–Cantor DNA distance and neighbor-joining methods. Bootstrap values represent percentages from 100 replicates of the data and percentages >80% are shown by *. The scale bars indicates 0.01 substitutions per nucleotide base.

