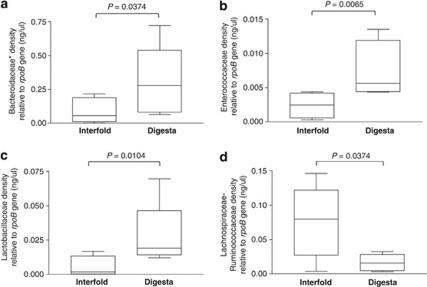
Figure 3.
Colonic interfolds harbor higher density of microbes of the families Lachnospiraceae–Ruminococcaceae. (a–d) Bacterial densities of interfold and digesta regions were examined using bacterial group-specific qPCR assays. The data depict density of each bacterial group relative to total Bacteria (rpoB gene) as measured by qPCR and DNA standard curves. Bacterial group-specific qPCR signals were normalized (divided) to total Bacteria (rpoB gene) qPCR signal. The rpoB is a gene highly conserved in the Bacteria domain. The asterisk in a indicates that the group queried by this primer set also amplifies 16S rRNA genes of Bacteroidaceae, Porphyromonadaceae and Prevotellaceae. Each PCR assay was performed in triplicate. Bars in each figure represent mean values+s.e. (n=6). Comparisons were made using the Mann–Whitney–Wilcoxon test. Differences were considered significant if P<0.05. Results of qPCR assays are shown in box plots and include their five-number summaries (the smallest observation, lower quartile, median, upper quartile and largest observation).

