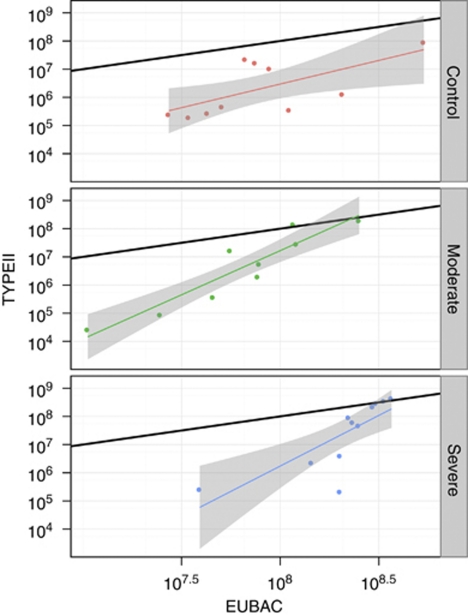
Figure 7.
Ratio between the numerically dominating type II methanotrophs (pmoA copy number) and total eubacteria (16S rRNA gene copy). Assuming two copies each per cell, the black lines are drawn assuming that methanotrophs make up 1% of all bacteria. Red, green and blue denotes control, moderate and severe disturbances, respectively. Linear regressions are surrounded by 95% confidence intervals (grey). For details see text.

