Figure 1.
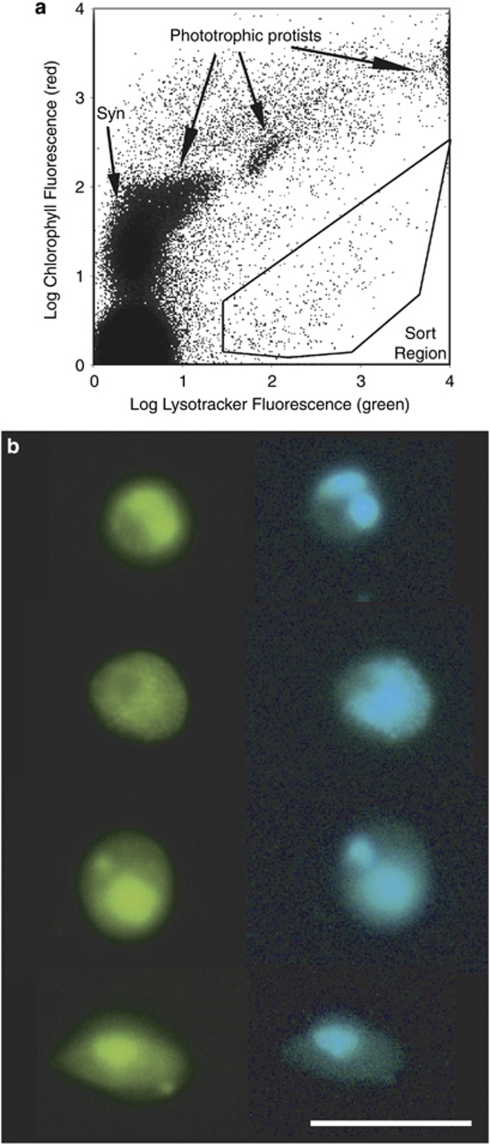
(a) Flow cytometric sort region for heterotrophic protists. Target cells were inside the sort region, with high green fluorescence (Lysotracker-stained vacuoles) and low red fluorescence (chlorophyll). Phototrophic protists have high chlorophyll and Lysotracker fluorescence. Cells between the sort region and the phototrophs are likely heterotrophs with ingested chlorophyll or mixotrophs. Prokaryotes (for example, Synechococcus sp.) do not stain with Lysotracker. The large population in the lower left is noise and/or heterotrophic bacteria. Side scatter (not shown) was also used to limit the sort to smaller cells. (b) Epifluorescence photomicrographs of sorted heterotrophic protists. Cells were stained with proflavine (left, blue excitation) and DAPI (right, ultraviolet excitation) after sorting. Images of each cell were contrast-stretched. Scale bar is 10 μm.

