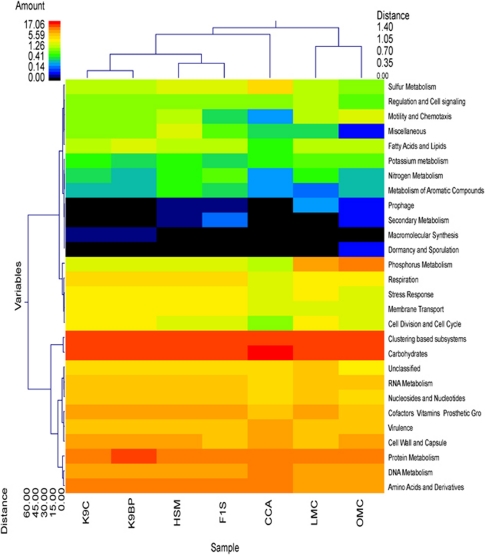
Figure 2.
Metabolic clustering of canine, human, mouse and chicken gastrointestinal metagenomes. A double hierarchical dendogram, using the weighted-pair group clustering method and the Manhattan distance method with no scaling, shows bacteria distribution (classes) among canine (K9C; K9BP), human (F1S; HSM), murine (LMC; OMC) and chicken (CCA) metagenomes. Dendogram linkages are based on relative abundance of the metabolic classes (variables) within the samples. Clustering of the samples was similarly based on comparative abundance of the metabolic classes among individual samples. The heat map depicts the relative percentage of each metabolic class (variables clustering on y axis) within each sample (x axis clustering). The heat map colors represent the relative percentage of the metabolic classes within each sample, with the legend indicated at the upper left corner. The samples along the x axis with Manhattan distances are indicated by branch length and an associated scale located at the upper right corner. Clustering based on Manhattan distance of the metabolic classes along the y axis and their associated scale is indicated in the lower left corner.

