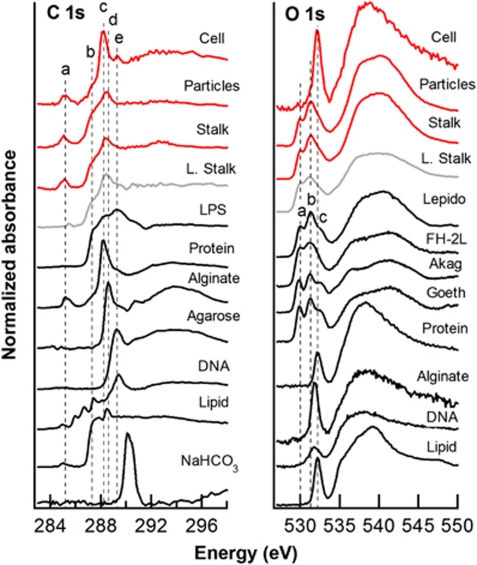
Figure 5.
C and O 1s NEXAFS spectra of M. ferrooxydans culture (stalk, cells and surrounding minerals), Loihi microbial mat stalk, and standards. Dashed lines indicate the following energies: 285.2, 287.3, 288.2, 288.6 and 289.3 e (see Table 1); 529.9, 531.3 and 532.1 e (O 1s). C standards include E. coli lipopolysaccharide (LPS), bovine serum albumin (protein), alginate (acidic polysaccharide), agarose (neutral polysaccharide), DNA and 1,2-dipalmitoyl-sn-glycero-3-phosphoethanolamine (phospholipid). FeOOH standards (phase confirmed by X-ray diffraction) include lepidocrocite, two-line ferrihydrite, akaganeite and goethite. Iron(III) oxyhydroxides exhibit transitions occurring from both O 1s (peaks a and b) and OH 1s (peak c) core orbitals.

