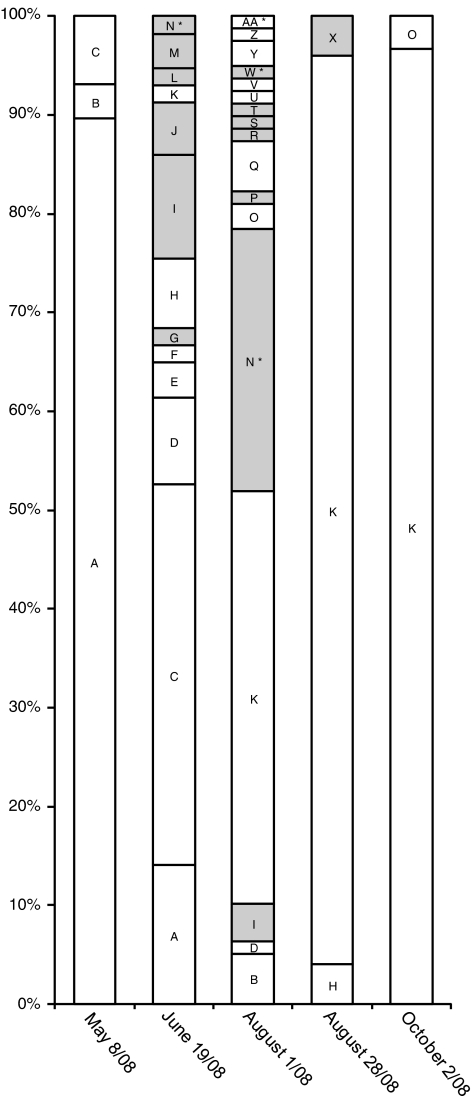
Figure 4.
Composition of Lake Ontario psbA clone libraries. The X axis is labelled with the sample collection dates for each clone library of PCR-amplified psbA gene fragments, and the Y axis represents the proportion of each unique OTU within an individual clone library. The letters are arbitrarily assigned labels used to identify unique OTUs. Shaded boxes indicate OTUs closely related to known cyanobacteria or phage, and OTUs containing potential chimeric sequences are indicated with an asterisk (*).

