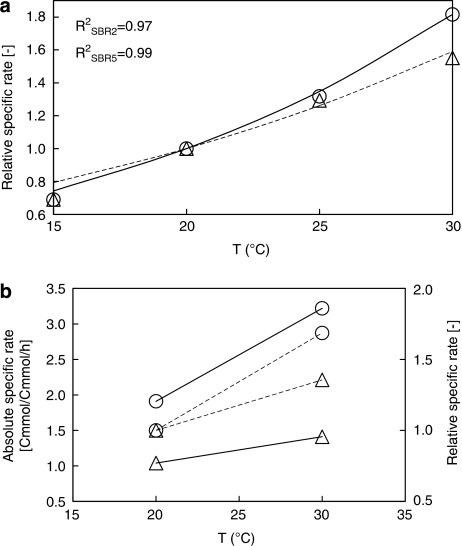
Figure 3.
Short-term temperature change experiment. (a) Arrhenius efficiency obtained from the biological oxygen monitor experiments. Symbol (experimental data), lines (modeled data). Circle and solid line indicate the data from P. acidovorans enrichment. Triangle and dashed line represent the data from Zoogloea enrichment. (b) Absolute and relative comparison of substrate uptake rate of P. acidivorans (circle) and Zoogloea (triangle) when increasing temperature by 10 °C. Solid lines indicate the absolute increase of substrate uptake rate and dashed lines represent the relative increase of substrate uptake rate.

