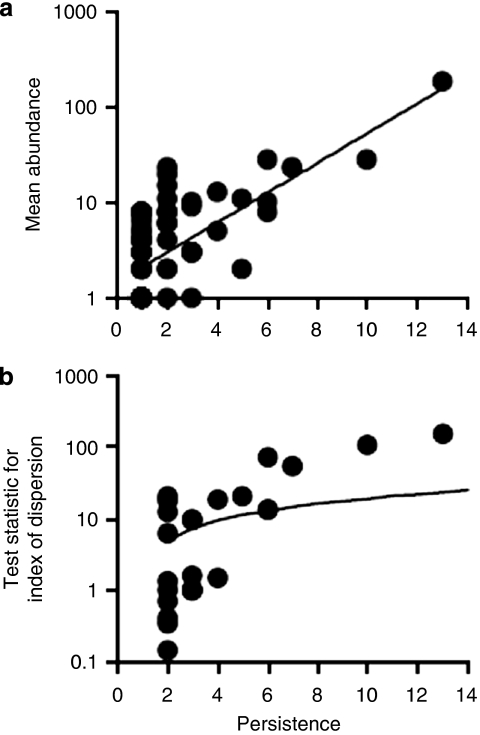
Figure 1.
Distribution and dispersal of bacterial taxa across patients. (a) The number of patients for whom each bacterial taxon was observed, plotted against the mean abundance (log10 scale) across all patients (r2=0.44; F1,80=62.2; P<0.0001). (b) Random and non-random dispersal through space visualised by decomposing the overall distribution using an index of dispersion based on the ratio of variance to the mean abundance for each bacterial taxon from the 14 patients sampled. The line depicts the 2.5% confidence limit for the χ2 distribution. The 97.5% confidence limit was not plotted, as no taxon fell below that line.

