
Figure 1.
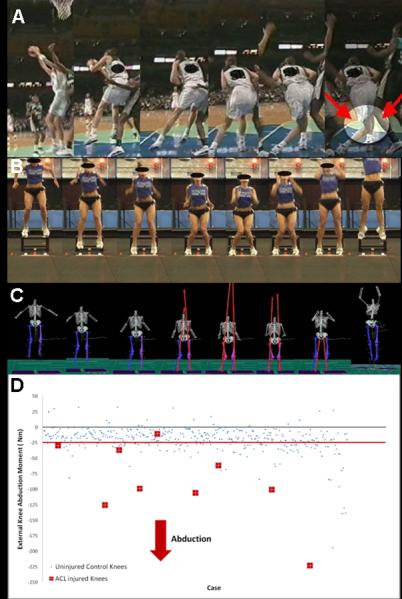
A. ACL injury mechanism with high knee abduction angle that is related to high LOAD.
B. Videographic depiction of athlete with kinematic pattern that is likely to demonstrate high LOAD.
C. Motion analysis depiction of athlete with kinematic and kinetic pattern indicative of high LOAD.
D. Scatterplot of data comparing those who went onto ACL injury to uninjured control subject. Red-line indicates established cut-point which provided maximum sensitivity and specificity to predict ACL injured status. Athletes who demonstrate LOAD beyond (negative values indicate increased LOAD) red line may be at “high risk” for ACL injury during competition (figure 1A).