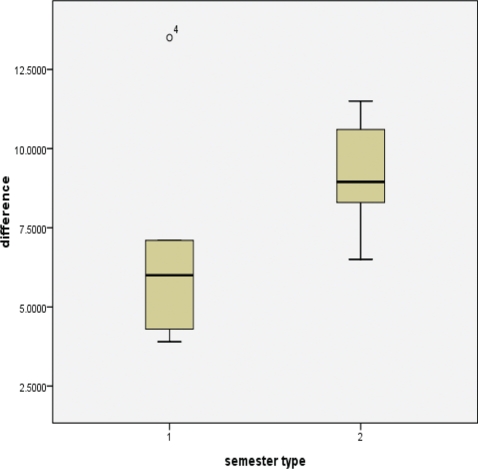
Figure 5.
Box-and-whisker plot of difference in posttest minus pretest score before (semester type 1) and after (semester type 2) the course redesign. There is a single outlier (small circle) above the box representing data from before the redesign (also apparent in Figure 4).

