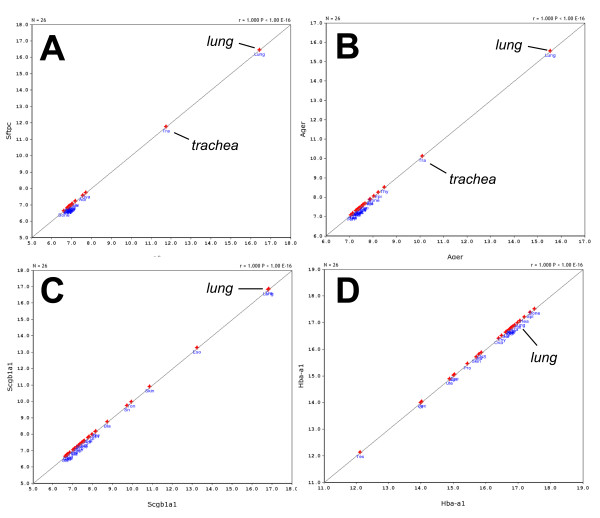
Figure 1.
Tissue distribution in 25 other tissues of some of the most highly expressed genes in the lung. The expression levels for (A) Stpc, (B) Ager, (C) Scgb1a1 and (D) Hba-a1 in different tissues are shown. Please note that in this representation the gene is correlated with itself to illustrate only its issue distribution.

