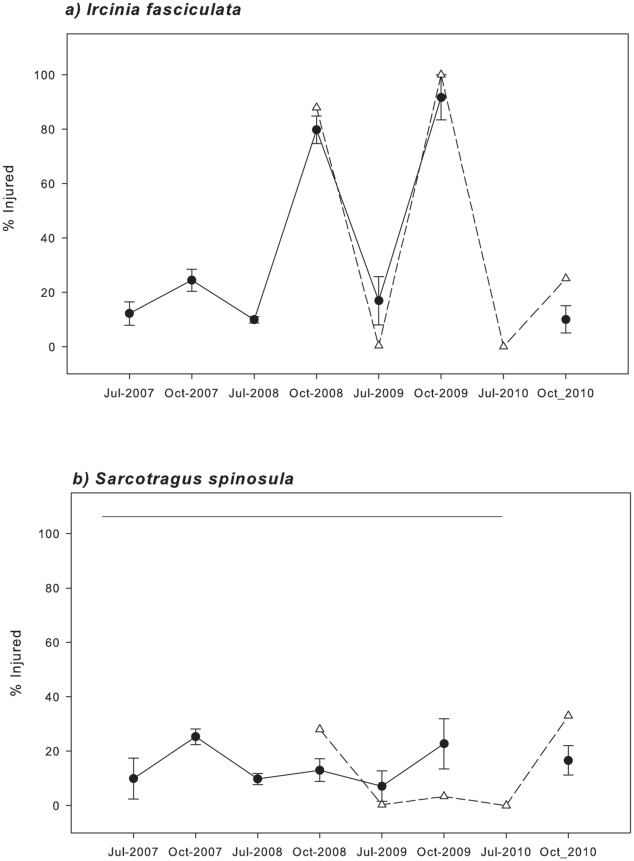
Figure 5. Mean percentages of injured Ircinia fasciculata (a) and Sarcotragus spinosulum (b) specimens recorded in Cabrera NP (circles) and Scandola RN (triangles) during the monitoring period.
Bars represent standard errors. Mean concentrations, which were not significantly different in a Tukey test, are joined by horizontal lines.

