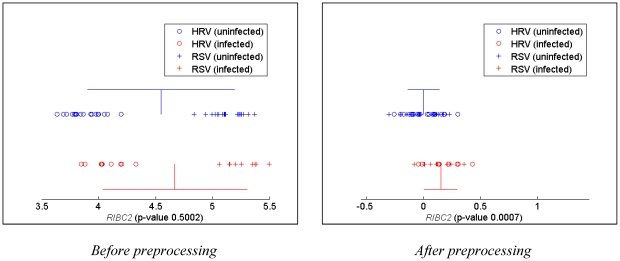
Figure 1. Effects of preprocessing by the supplementary software of Zaas et al. [9] on real gene expression data.
Gene expression profiles of the uninfected subjects are shown in blue staggered on top of the profiles of the infected subjects highlighted with red. The blue and red vertical line segments denote locations of the mean expression in the uninfected and infected groups, respectively. Likewise, blue and red horizontal line segments emanating in both directions from the means denote one standard deviation within the uninfected and infected groups, respectively. P-values produced by a two-sample t-test with unequal variances are shown in parenthesis.

