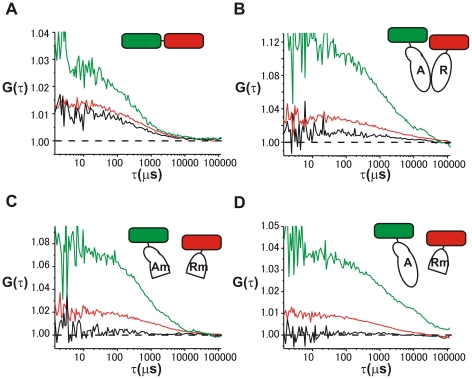
Figure 2. FCCS measurement of differently labeled CREB1 isoforms in the nuclei of living cells.
The inset is a schematic diagram showing fluorescent-labeled proteins used with each experiment. Auto- and cross-correlation curves of fluorescent-labeled proteins were shown for EGFP- mRFP chimera protein (A), EGFP-Act and mRFP-Rep (B), EGFP-Act mut and mRFP-Rep mut(C), and EGFP-Act and mRFP-Rep mut (D), respectively. The green curve denotes the auto-correlation of the green channel [Gg(τ)], the red curve the auto-correlation in the red channel [Gr(τ)] and the black curve the cross-correlation curve [Gc(τ)].

