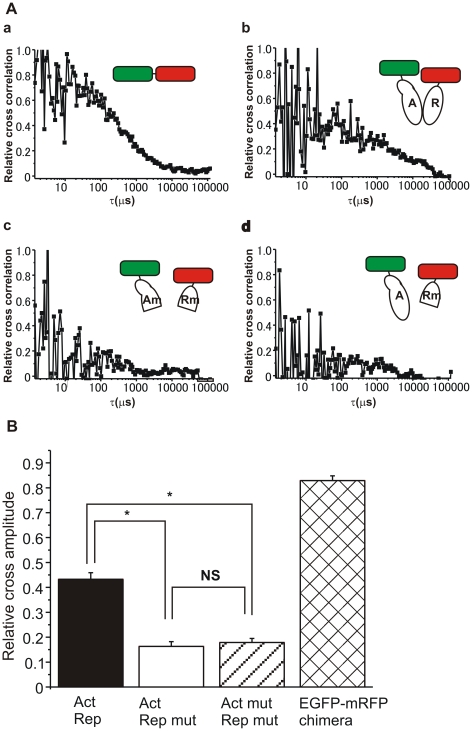
Figure 3. The quantitative evaluation of FCCS data for interaction between CREB1 isoforms.
A, Relative cross-correlation [(Gc(τ)−1)/(Gr(0)−1)] calculated from FCCS measurement. Typical curves of cross-correlation were shown for EGFP- mRFP chimera (a), the EGFP-CREB1 activator isoform protein and the tandem mRFP-CREB1 repressor isoform protein (b), the EGFP-truncated CREB1 activator isoform protein and the tandem mRFP-truncated CREB1 repressor protein (c), and the EGFP-CREB1 activator protein and the tandem mRFP-truncated CREB1 repressor protein (d). B, Relative cross amplitudes [(Gc(0)−1)/(Gr(0)−1)] calculated from each FCCS measurement that corresponds to the fraction of the associated molecules (N c/N g). Here N c is the average number of particles that have both green and red fluorescence in the excitation-detection volume, and N g is that of the green fluorescent particles. Each relative cross amplitude: EGFP-Act and mRFP-Rep (black bar), EGFP-Act mut and mRFP-Rep mut (white bar), EGFP-Act and mRFP-Rep mut (hatched bar), EGFP-mRFP chimera proteins (cross-hatched bar).

