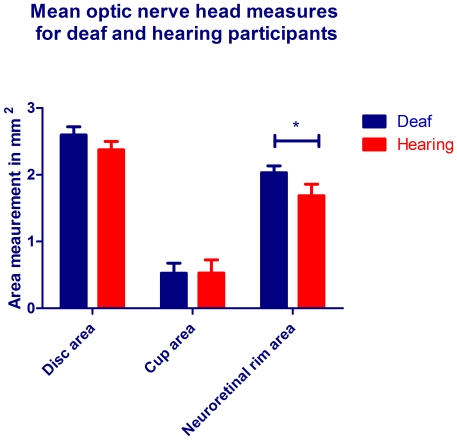
Figure 1. Mean areas of optic nerve head measures for deaf and hearing participants.
Bars indicate areas in mm2 for the deaf (blue) and hearing (red) participants. Measurements were taken from the six radial optic nerve head scans described and error bars denote the standard error of the mean (SEM). Due to the non-normative statistical behaviour of area data, raw data measurements were root squared for statistical analysis.

