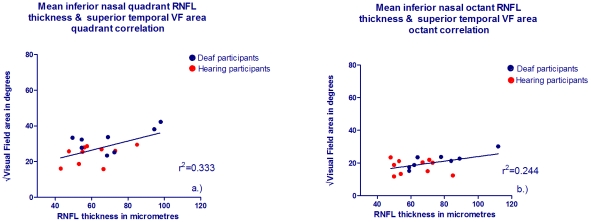
Figure 5. RNFL thickness and corresponding visual field quadrant/octant area correlations for deaf and hearing participants.
The x axis shows RNFL thickness in µm for deaf (blue symbols) and hearing (red symbols) for the root squared of a.) Inferior nasal quadrant and corresponding superior temporal mid-peripheral visual field quadrant area and b.) Inferior nasal octant and corresponding superior temporal mid- peripheral visual field octant area in degrees.

