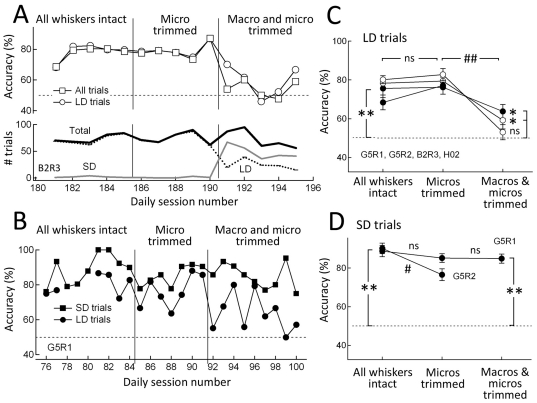
Figure 4. Dependence of SD and LD texture discrimination on microvibrissae vs. macrovibrissae.
A, Performance of rat B2R3 on P120 vs. P1500 sandpaper discrimination during sequential trim of micro- and macrovibrissae. Each point is one behavioral session. Bottom: number of SD, LD and total trials per session. B, Performance of rat G5R1 on smooth-grooved discrimination. There were an average of 23 SD and 25 LD trials per day. Gaps indicate days with too few LD trials to calculate mean accuracy. C, Mean discrimination accuracy for LD trials for all rats in whisker trim experiments. Filled symbols are smooth-grooved discrimination. Open symbols are P120 or P150 (very rough) vs. P800 or P1500 (smooth) sandpaper discrimination. Each point is mean of 6–21 sessions (83–802 LD trials). Error bars are SEM across daily sessions. * and **, p<0.003 and p<2×10⁻⁶ relative to chance (binomial exact test). #, p<0.003 difference between groups (2-sample equal proportion test). ns, not significant. D, Mean discrimination accuracy for SD trials for rats performing smooth-grooved discrimination. Each point is the mean of 7–21 sessions (116–385 SD trials). SD trials in sandpaper discrimination were too few to be analyzed.

