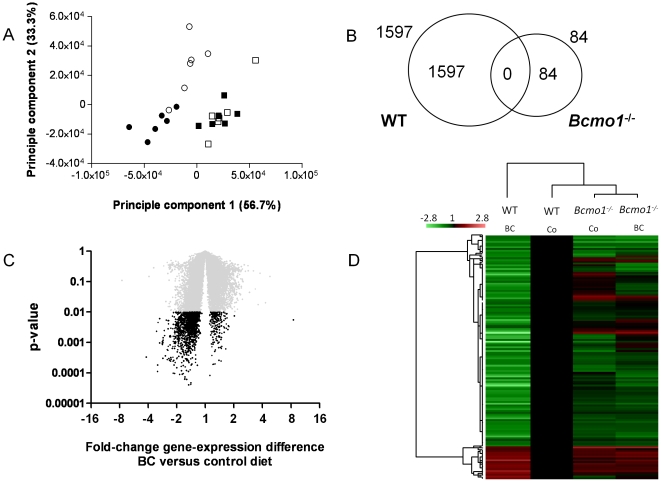
Figure 4. Supplementation of β-carotene alters gene expression profiles in wild-type but not in Bcmo1-/- mice.
(A) Principal component analysis of transcriptional profiles in inguinal white adipose tissue of female wild-type (circles) and Bcmo1 -/- (squares) mice fed the control diet (open symbols) or the β-carotene diet (closed symbols). Genome-wide expression profiles were obtained using the 4×44 k Agilent whole mouse genome microarrays for each animal in the experiment (n = 6 per group). (B) Venn diagram representing the number of significantly regulated genes (p<0.01) due to BC supplementation in wild-type (WT) and in Bcmo1-null (Bcmo1 -/-) mice and the number of significantly regulated genes regardless of genotype (overlap). (C) Volcano plot representing the effect of BC supplementation on gene expression in WT mice, with the fold-change on the x-axis and the corresponding Student's t-test p-value on the y-axis. Every spot is a single gene and in black are all genes with a p-value <0.01. (D) Heat map representing the expression level of all genes regulated by BC with a Student's t-test p<0.01 in the WT mice in all four groups; WT control (Co) diet, WT BC diet, Bcmo1 -/- control diet and Bcmo1 -/- BC diet. Relative expression of every single gene was compared to gene expression in WT mice on the control diet and consequently, gene expression of every single gene in WT mice on the control diet was set to 1.0.

