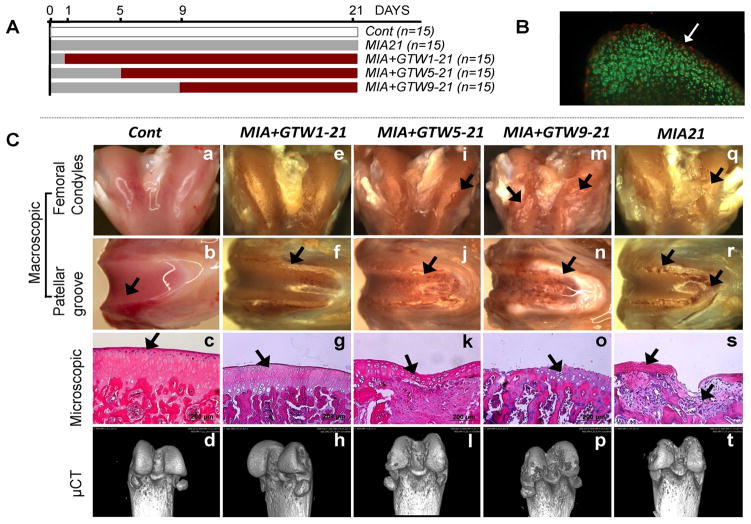
Figure 1.
Effects of GTW on the progression of MIA. (A) Experimental scheme. (B) Cartilage section showing dead (red) and live (green) cells on day 1 post-MIA inception. (C) Macroscopic, microscopic and bone imaging by μCT of: healthy sham control femur showing smooth surface, normal histology and no bone lesions on the femoral condyles and patellar grove (see Supplemental Data for 360° μCT projections) (a – d); MIA+GTW1-21 cartilage showing no surface abrasions on the condyles, some cartilage lesions on the patellar groove and ridges, near normal histology, and no bone involvement by μCT images (e – h); MIA+GTW5-21 cartilage showing some abrasions on condyles, cartilage damage on patellar groove and ridges, H&E section showing focal matrix condensation, cell clustering and disorganization, fibrocartilage formation, and some bone lesions by μCT images (i – l); MIA+GTW9-21 cartilage demonstrating extensive cartilage lesions on condyles and patellar groove, severe cartilage loss, denuded bone, and excessive bone lesions on femoral condyles and patellar grove in μCT images (m – p); MIA21 cartilage exhibiting cartilage matrix loss, delamination of superior surface, excavation and matrix loss in superficial and mid zone (q – t). Each femur is representative of each group showing similar characteristics (n=10).

