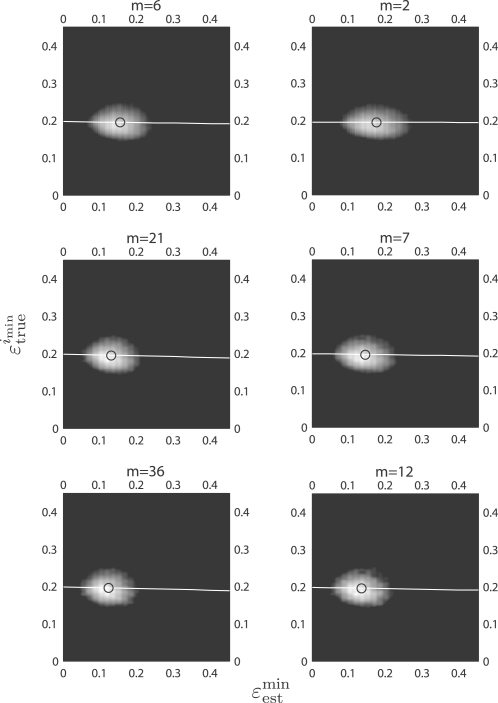
Fig. 2.
The joint distributions between ϵestmin and ϵtrueimin with respect to the collection size m, for all classifier rule models for m = 6, 21, 36 (left column) and for single LOO error estimation for m = 2, 7, 12 (right column). The real dataset is multiple myeloma by Zhan et al. (2006). The white line shows the regression line and the circle indicates the sample mean of the joint distribution.

