
Figure 1.
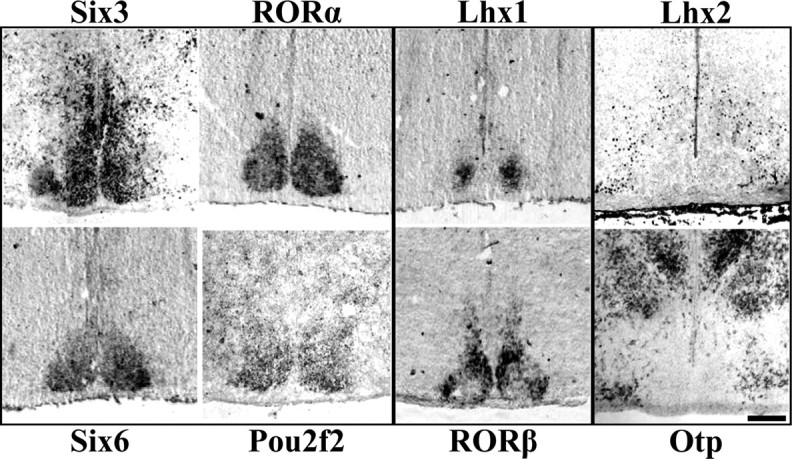
Diverse patterns of transcription factor expression in P0 mouse SCN. Representative ISH and IHC images of mid-SCN coronal sections showing specific expression throughout the entire SCN but not adjacent hypothalamus for Six3, RORα, Six6, and Pou2f2, but restricted localization within the SCN for Lhx1 and RORβ. Lhx2 and Otp are expressed outside the SCN, indicating a transcription factor boundary. Scale bar, 250 μm.