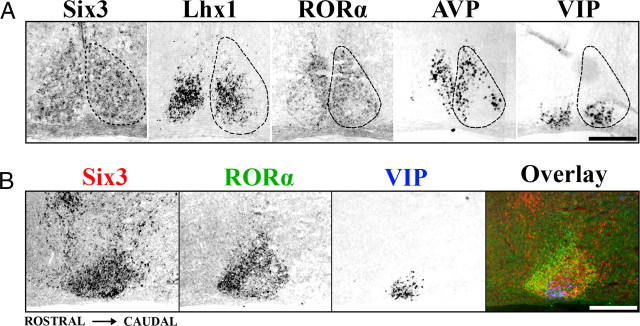
Figure 2.
The adolescent mouse SCN shows discrete patterns of transcription factor expression. A, Representative ISH images showing localization of Six3, Lhx1, and RORα expression within coronal sections of mid-SCN at P15. Note the discrete localization of RORα to a region overlapping AVP but not VIP expression, whereas Lhx1 overlaps both. Dotted lines indicate the margins of the SCN. B, ISH images from adjacent sagittal sections of Six3 (red), RORα (green), and VIP (blue) are overlaid in pseudocolor, showing the full rostral to caudal expression of Six3 throughout the SCN and the localized absence of RORα from the VIP-expressing region. Scale bars, 250 μm.

