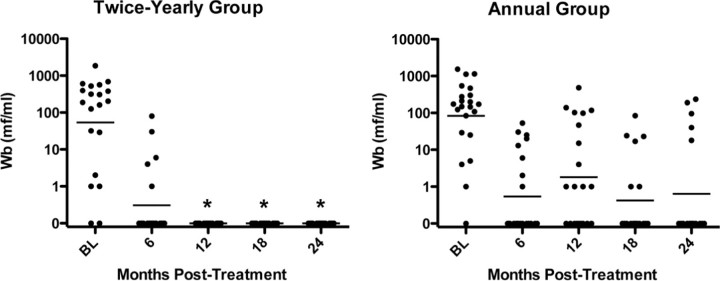
Figure 2.
Reduction of microfilaremia after high-dose, twice-yearly albendazole and ivermectin (A), compared with standard-dose annual treatment (B). Each symbol represents the value for an individual patient. The horizontal line indicates the geometric mean for the group. *P<.05, annual versus twice-yearly treatment (Wilcoxon-Mann-Whitney U test).

