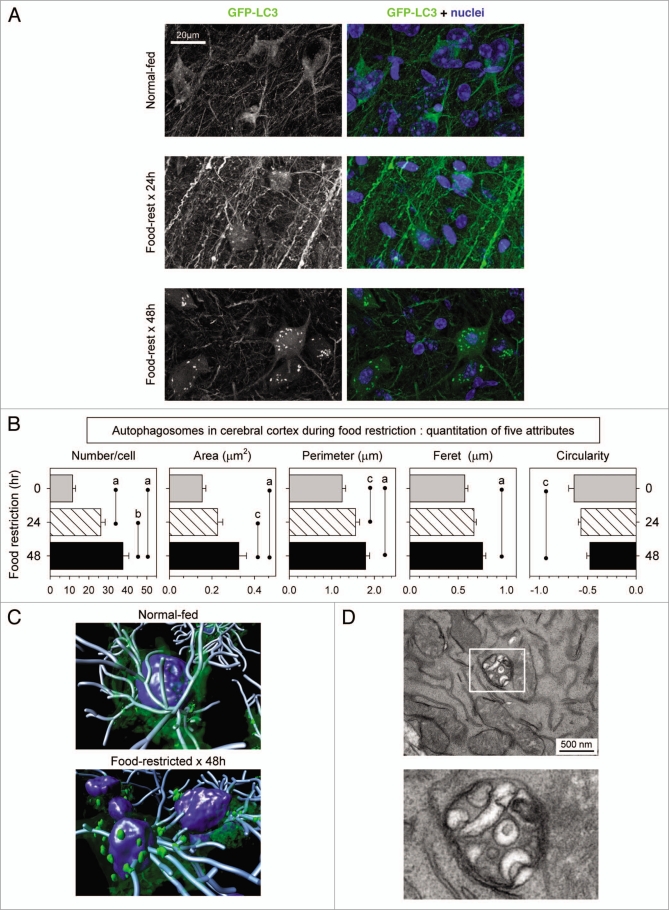
Figure 2.
Identification and quantitation of autophagosomes in the cerebral cortex of food-restricted mice. GFP-LC3 transgenic mice were food-restricted for 24 or 48 hours, and then the brain was isolated and sagittal vibratome-cut sections were analyzed by confocal microscopy. (A) Representative flattened images of GFP-LC3 signal in cortical neurons are shown. A merged fluorescent image for each mouse is shown in the right-hand column; GFP-LC3 (green), nuclei (blue). (B) Quantitative analysis of autophagosomes in cortical neurons. Data are shown as the average + SE of 50 cells from 2 or 3 mice per group; ap < 0.001, bp < 0.01, cp < 0.05. A 3D rendering of these neurons in normal-fed and food-restricted mice is shown in (C). The isosurface tool was used to demarcate the nuclei (blue) and autophagosomes (green), and neurites were traced with filament tracker, using IMARIS software (Bitplane, Inc.). (D) A TEM image from a section of cortical neuron from a 48-hour food-restricted mouse is shown; the boxed area is enlarged to better demonstrate that the enclosed structure is double-membraned.

