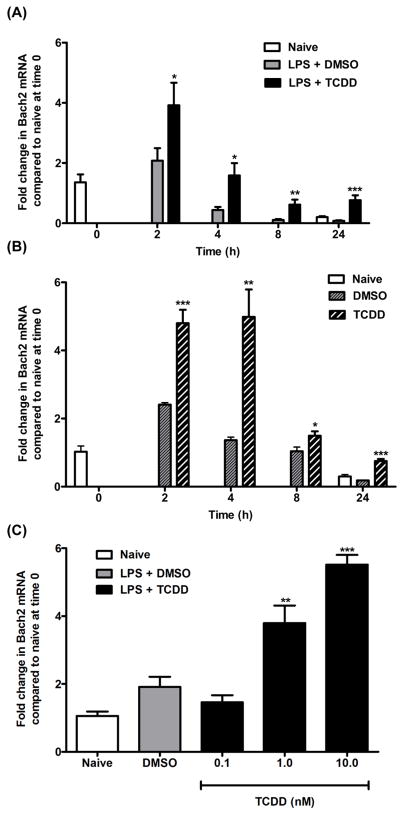
Figure 2.
Time course and concentration-response changes in Bach2 mRNA levels following TCDD-treatment. (A) B cells were activated with 10 μg/ml LPS and treated with 10 nM TCDD or 0.02% DMSO and analyzed for Bach2 mRNA using qRT-PCR at the indicated times. Naïve cells were not activated with LPS nor treated with TCDD or DMSO and were analyzed at 0 and 24 h. (B) Resting B cells were treated with 10 nM TCDD or 0.02% DMSO and analyzed for Bach2 mRNA using qRT-PCR at the indicated times. Naive cells were not treated with TCDD or DMSO and were analyzed at 0 and 24 h. The data in these graphs (A and B) represent mean ± S.E. of quadruplicate measurements at each time point of three experimental replicates. (C) B cells were activated with LPS (10 μg/ml) and treated with 0.1, 1.0, 10 nM TCDD or 0.02% DMSO. Bach2 mRNA was analyzed at 2 h using qRT-PCR. The data in all graphs represent mean ± S.E. of quadruplicate measurements at each treatment group of two experimental replicates. Comparisons were made between the TCDD-treated group and DMSO-treated group at each time point (A, B) or between each TCDD-treated group and the DMSO group (C). *, p < 0.05; **, p < 0.01; ***, p < 0.0001.

