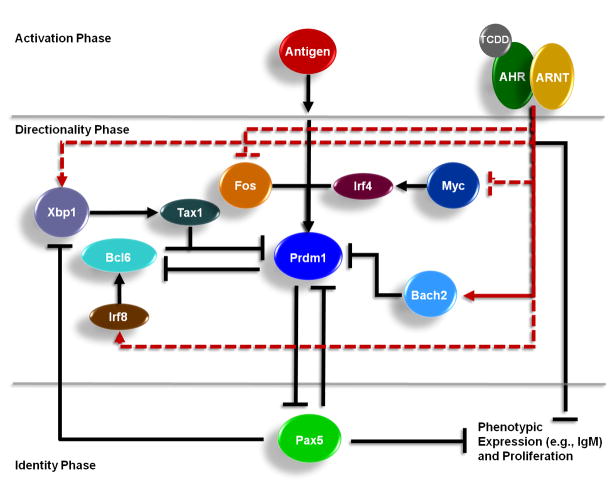
Figure 9.
Conceptual model depicting the mechanism of TCDD-mediated suppression of B-cell differentiation into plasma cells. The proposed model depicts the role of the AHR acting at multiple nodes in the signaling network regulating B cell differentiation. At the core of the signaling network are three key transcription factors involved in B-cell differentiation (Prdm1, Bcl6, and Pax5) that exist in negative regulatory feedback loops. Lines ending in arrows represent positive regulatory interactions and lines ending in a “T” represent negative regulatory interactions. The black lines represent signaling links previously established in the literature and the red lines represent signaling interactions identified in a previous integrated genomic analysis (De Abrew et al., 2010). The dashed red lines represent putative interactions that have not been functionally validated. The solid red line represents the functionally validated interaction in this study.

