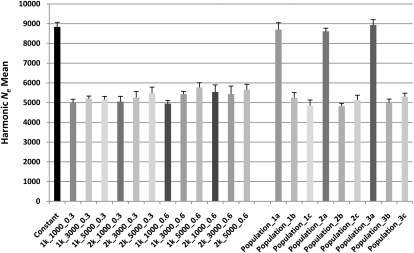
Figure 5.
The harmonic mean of Ne for each simulated population scenario over all genetic distances between 0.05 and 0.25 cM. The Ne illustrated is the mean from 100,000 independent simulations, with standard errors shown with error bars. The population characteristics are described in Methods and Supplemental Figure 7.

