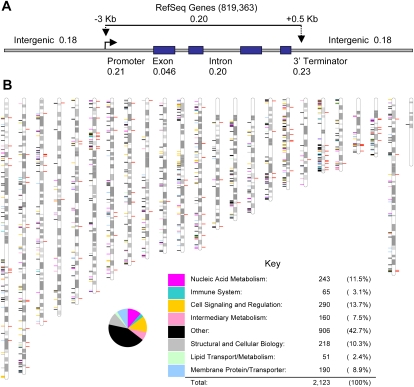
Figure 2.
Distribution of coding exon variants in the human genome. (A) The figure depicts a typical RefSeq gene and its features. 819,363 small INDELs from our study were mapped to RefSeq genes. The INDEL-to-SNP ratios for each genomic compartment are indicated. (B) The 1205 genes that were affected by 2123 coding exon variants (Supplemental Table 5) are indicated on the map of human chromosomes (colored marks to the left of the chromosomes indicate an affected gene). Each mark is indexed by color to indicate gene function (and is cross-referenced to the pie chart below). A red mark to the right of each chromosome indicates that the affected gene previously was linked to a known disease. The pie chart shows the functional breakdown of the coding variants.

