Figure 4.
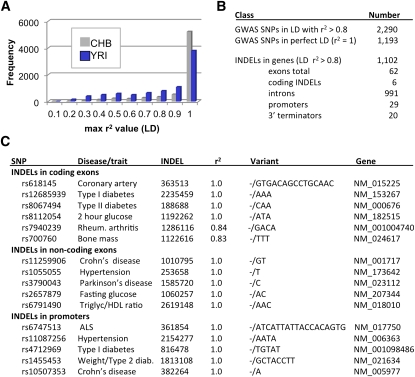
Linkage disequilibrium between SNPs and INDELs. (A) The r2 value was calculated for each SNP within a 1-Mb window of a given INDEL using the SNP genotypes that have been reported for HapMap 3 (http://hapmap.ncbi.nlm.nih.gov/) and our INDEL genotyping data from the same samples. For each population (YRI, CHB), the SNP with the maximum r2 value was identified (Supplemental Table 13). INDELs in perfect LD with a SNP have an r2 of 1.0. (B) LD also was examined for high-scoring SNPs (with P-values <0.001) that were identified in 118 GWAS studies (Supplemental Table 14; Johnson and O'Donnell 2009). GWAS SNPs that have high levels of LD (r2 > 0.8) with INDELs are summarized. (C) Examples of INDELs from B that map to functional regions of genes. The 16 examples were taken from a larger collection of 1102 INDELs that have high levels of LD with GWAS SNPs and also map to genes (Supplemental Table 15).

