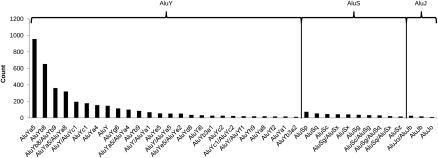
Figure 5.
Alu frequency distribution among subfamilies. We show the number of predicted Alu integrations in the eight genomes separated by the inferred Alu subfamilies. As expected, AluY class had the highest frequency, where AluJ was the rarest. The Alu classes (AluY, AluS, AluJ) are sorted from youngest to the oldest.

