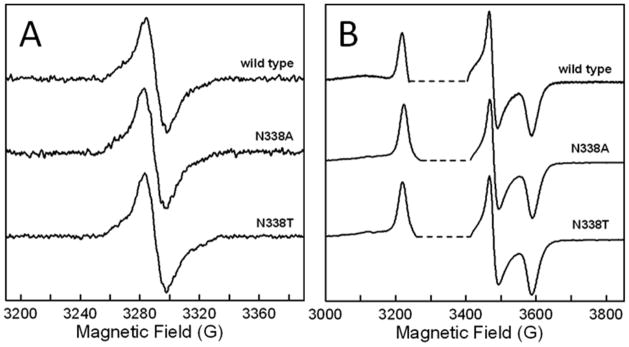
Figure 4.
X-band CW EPR spectra of R. sphaeroides ETF-QO. (A) FAD semiquinone signal recorded at 100 K, 9.23 GHz with 0.01 mW power. A similar lineshape, but with lower signal-to-noise, was observed at 293 K. (B) [4Fe-4S]+ signal recorded at 15 K, 9.35–9.42 GHz with 0.05 mW power. The saturated FAD semiquinone signal was deleted from (B) to aid in comparison (dashed lines). The anaerobic samples contained 20 mM Hepes and 20% glycerol (v/v) at pH 7.4. Spectra were recorded at their respective maximum semiquinone signals from the potentiometric titrations. The potentials were: wild type (−10 mV), N338A (−75 mV), and N338T (−35 mV).

